TOP STORIES
CARTOONS
MAGIC MONEY TREE
POSH GRAMMAR
OSBORNE KERCHING!!
PROMISES PROMISES
SOUTHERN FAIL
DUMB POLLSTERS
DON'T BLAME TRUMP!
£13bn APPLE TAX DODGE
SAFE SEATS = BREXIT?
UKIP v LABOUR
ALL OUT OF IT TOGETHER
EU IMMIGRATION
TORY v TORY
PRISON SUICIDES
LONDON LEAVES UK!
EU v TORY MANDATE
HMRC IS A TAX HAVEN
PANAMA TAX LEAK
IDS v IDS
RICH v POOR
POSH BOYS
HELP2BUY PROFITEERS
LLOYDS, RBS CEO PAY
HSBC DRUG MONEY
PM'S MUM FIGHTS CUTS
PEAK "STUFF" IS HERE
HMRC GOOGLY
PENSION TAX RAID
Showing posts with label pay. Show all posts

Tuesday, 16 May 2017

Tuesday, May 16, 2017 Posted by Hari No comments Labels: , , , , , , , , , ,
Fee and KJ hazard a guess...

SOURCE PUBLIC SECTOR EXECUTIVE: Lib Dems join Labour in pledge to scrap 1% public sector pay cap
Liberal Democrat leader Tim Farron has pledged to put an end to the government’s 1% public sector pay cap and uprate wages in line with inflation, a commitment that is in line with Labour’s pledges according to its leaked manifesto. Farron, who accused the Conservatives of treating health workers “like dirt” at yesterday’s Royal College of Nursing (RCN) annual conference, said nurses and teachers could be £780 better off by 2021 as part of his party’s plans. Conversely, it is estimated that a new nurse would be around £530 worse off by then under current Tory plans, while a primary school teacher would lose out on £550 and an army sergeant £830, according to Lib Dem analysis. The party’s leader also said that the controversial pay cap, branded by many unions as a “cruel” policy, would leave the average civil servant £800 worse off by 2021. Vince Cable, Lib Dem shadow chancellor and the former business secretary, said: “Public sector workers are facing a double blow at the hands of this Conservative government, with years of pitiful increases to pay combined with a Brexit squeeze caused by soaring inflation. “Our NHS and schools are already struggling to recruit the staff they need. "Living standards are falling, prices are rising and nurses are going to food banks – but Theresa May doesn’t care.” Just last week, a leading trade union claimed the cap policy will cost the UK economy around £16bn in lost wages by the end of the decade. Analysis by the GMB also predicted that between 2017 and 2020, five million workers in the public sector will find themselves out of pocket by around £3,300 each. As expected, the cap has been an extremely controversial policy since its inception, and is now threatening to drive the nursing workforce to its first-ever strike in the RCN’s 100-year history.


OUR RELATED STORIES:

£100bn a year is missing from our high streets thanks to 50 years of pay squeezes. See the stats

Hoping for a Brexit U-turn? Then let's U-turn inequality. Except Hammond’s budget is making it worse

Why does everyone say inequality is falling when it's rising? Measure all wealth/assets, not just incomes

The NHS is not a “cost”. It creates nationwide jobs, technology, growth and wealth. Oh, and health

FTSE bosses take 2.5 days to earn what you earn all year. Data shows they don't deserve it

All governments agree to fix the housing crisis. Latest figures show we're still not even trying

Recovery? What recovery?! Bank of England director explains why broke Britain is still broken

Brexit was about inequality in Britain, not immigration. Have our politicians realised this?

See the Stats: Osborne's 2016 budget protected the wealthiest while the most vulnerable suffer

Inequality: the UK has 9 of the 10 poorest regions in Northern Europe. But Inner London is the richest

Graphs at a glance: With highest pay and highest job growth is London sucking the life out of Britain?

Londoners earn 15% more 'cos London is damn expensive! But the poorest 5th in London are paid only 4% more

Graphs at a glance: Britain is already a low-pay economy with falling average wages

Is your Cost of Living crisis over?! Average wages are still back where they were 10 years ago

Saturday, 13 May 2017

Saturday, May 13, 2017 Posted by Hari No comments Labels: , , , , , , , , , ,
A pound’s worth of product is not worth a pound when you’ve made it. It’s worth a pound when someone has bought it. That’s why Britain needs a pay rise.

There’s no rise in UK sales without a rise in UK incomes. That’s why we’ve not had a recovery. Only a recovery in credit card debt!

Whichever party understands that, vote for them.

Wages have flatlined since July 2005, says the Office for National Statistics. But it’s worse than that. Notoriously, the Average Weekly Earnings (AWE) data never include the earnings of the self employed, which have been getting worse, so that means there has been an overall decline.


If you’ve been one of the lucky ones who have seen his/her earnings increase, you have a counterpart who saw the opposite. As the graph tells us, the more you earned the more someone else didn’t. So if you’re trying to sell them something, you’re in trouble too.

Those people earning less: are they all lazy and stupid? Nigh on half the workforce?!

A balance must be struck between earnings rising too fast (businesses and their customers can’t afford it. So the business goes bust) and too slow or not at all (businesses can fill their shelves, but nobody can afford to buy the damn stuff. So the business goes bust). That balance has been lost since the 1970s. For too long wages, as a percentage of the nation’s GDP, have been falling.


That 10% drop in the UK’s wages bill, compared to 50 years ago, equates to around £100bn a year in spending being taken off our high streets.

Now take a look at the list of sectors where wages are falling. If your business depends on selling to people working in those sectors, you’d better pray they get a pay rise.


Yes, I said pray. Because businesses, in competition, find it genuinely difficult to coordinate a pay rise lest someone breaks ranks and win-wins by keeping pay down while selling to those who got the rise. That’s why unions do us all a favour, by coordinating that pay rise. Government too, by legislating that rise.

The Resolution Foundation, digging into Office for National Statistics data on wages, says around 40 per cent of the workforce are in sectors where pay is falling in real terms.

This is despite another “good performance” on jobs, with fast growth in hours worked, employment remaining at a record high and unemployment falling by 45,000. Although, notoriously again, the official employment data says anyone who has worked a measly one hour a week is “employed”. One hour! What a job that must be!

We’re wasting our time if jobs are being created, but incomes aren’t rising. We’re driving with the hand brake on.

“But having a job matters more than having a pay rise!” says the tub thumping right, who see low pay as a way of creating jobs. These are the same people who say “Those Commies, they think full employment matters more than growing the economy.” They’re asking for the same thing as the Commies now. Beautiful! Someone should tell them that if wages don’t rise, economies simply don’t grow *.


* ...except, of course, through immigration. More people, more GDP. Simples. No wonder neither New Labour nor the Tories cut immigration. Immigration is not the cause of our problems **, it’s the only thing that’s making our economy look as though it has a future.

** Do you seriously think if the population had risen through more British babies instead of immigrants, those past governments would have built the 250,000 houses a year we need, increased spending on the NHS and schools to shorten those queues, and raised those wages?

Sunday, 26 March 2017

Sunday, March 26, 2017 Posted by Hari 1 comment Labels: , , , , , , , , , , ,
Almost four decades of widening inequality caused Brexit. Who seriously thinks we’d have voted Brexit if low-end wages had risen in line with growing national wealth? If low income workers had been saving, rather than borrowing or going without? Instead, since 1979, the Tories increased inequality. Worse, Labour failed to reverse it. In fact, it crept up further. Immigration and the EU is getting the blame for that poverty. But neither caused it.

Source: Institute for Fiscal Studies http://www.ifs.org.uk/publications/4637
NOTE: The “Gini coefficient” is an internationally used measure of inequality, where zero corresponds with perfect equality (where everyone has the same income) and 1 corresponds with perfect inequality (where one person has all the income, and everyone else has zero income).

Inequality so what? It means we’ve become a nation of borrowers. Since the 1980s the bottom 50% have actually had to borrow money to cover their living costs. As the graph shows, the poorer you are, the more you had to borrow. And before you shout “If you can’t afford it, don’t buy it!” where do you think that huge chunk of the nation’s high street spending is going to come from, that’s paying your wages?! The "Savings Ratio" in the graph shows what percentage of income different groups (the poorest to the richest) save. A negative Savings Ratio means they are borrowing. 


SOURCE: Resolution Foundation report "Gaining from growth: The final report of the Commission on Living Standards"

So, anyone hoping that Brexit voters will change their mind before the EU plug is pulled must therefore pray that inequality gets better. But Chancellor Philip Hammond’s budget is about to make it worse.

Here’s a graph of how incomes changed in the first four years of the “cataclysmically awful” bank bust (2007/8 to 2011/12), overlaid with how incomes will change thanks to Hammond’s budget (2016/17 to 2021/22).

SOURCE: Resolution Foundation report: “Are we nearly there yet? Spring Budget 2017 and the 15 year squeeze on family and public finances”

The lines show household net income growth (i.e. after including tax and benefits, and housing costs) for all working-age households. The poorest are on the left, the richest on the right. The bank-bust brown line shows everyone’s growth was negative, but the poorest suffered least and the super-rich most. Hammond’s blue line shows the poorest will suffer more than anyone has since 2007/8, while incomes will actually grow for the top 50%, the richer the better.

The graph comes from a report by the Resolution Foundation, who said: “the final four years of the current parliament look like being worse for poorer households than the financial crisis period itself.”

And before you accuse the Resolution Foundation of being too lefty, its boss is David Willetts, the Tory peer and former cabinet minister.

Someone needs to tell Hammond that a recovery needs people to spend money. But Hammond’s plan is to give more money to people who will save it, and less to people who would spend it. It’s not going to work. Duh!


What of UK average earnings as a whole? Overall, has the UK got a pay rise yet, since the bank bust? Paul Johnson is the boss of the Institute for Fiscal Studies. The IFS is one of the few research bodies that politicians don’t argue with, such is the robustness of their work. He said: “On current forecasts average earnings will be no higher in 2022 than they were in 2007. Fifteen years without a pay rise. I’m rather lost for superlatives. This is completely unprecedented.”


Unprecedented. The never-ending stagnation has forced commentators to dive deeper and deeper into their tattered history books as every year passes. Yup, this has been the worst recovery for wages since... Napoleonic times!


SOURCE: Resolution Foundation report: “Are we nearly there yet? Spring Budget 2017 and the 15 year squeeze on family and public finances”

The Resolution Foundation report confirms it: “we are on course for average pay across the decade to 2020 to be lower than the average for the decade before. That would represent the worst decade for real earnings growth in 210 years.”

“But Brexit is not simply about inequality and wages. Get real! Plenty of Brexiters just don’t like immigration and the EU.” Sure, but there aren’t nearly enough of them to win a referendum on their own.

Both Theresa May and Philip Hammond voted Remain. Now they are the PM and Chancellor of Brexit Britain. What are they doing to prove their Brexit credentials? By deepening inequality, they ensure the fervour for Brexit never goes away. I guess that’s kind of pro-Brexit.

Saturday, 11 March 2017

Saturday, March 11, 2017 Posted by Hari No comments Labels: , , , , , , , ,
Fee and Chris wonder whether a female PM's chancellor will do better...

SOURCE GUARDIAN: Women bearing 86% of austerity burden, Commons figures reveal
Labour has urged the Conservatives to carry out a gender audit of its tax and spending policies, as the shadow equalities minister, Sarah Champion, published analysis showing that 86% of the burden of austerity since 2010 has fallen on women. Champion said research carried out by the House of Commons library revealed that women were paying a “disproportionate” price for balancing the government’s books. The analysis is based on tax and benefit changes since 2010, with the losses apportioned to whichever individual within a household receives the payments. In total, the analysis estimates that the cuts will have cost women a total of £79bn since 2010, against £13bn for men. It shows that, by 2020, men will have borne just 14% of the total burden of welfare cuts, compared with 86% for women. Many of the cuts announced in earlier years by former chancellor George Osborne, including a four-year freeze on many in-work benefits and reductions in the universal credit, are yet to bite. Hammond has loosened Osborne’s fiscal rules, but he will press ahead with most of the pre-planned austerity measures – though the tax credits rebellion forced the government to promise not to look for fresh savings from the welfare bill in future years. Mary-Ann Stephenson, co-director of the Women’s Budget Group lobby group, condemned the Tories in light of the new research. She said: “The chancellor’s decision to continue with the decisions of his predecessor to cut social security for these low income families, at the same time as cutting taxes, is effectively a transfer from the purses of poorer women into the wallets of richer men.” The government publishes an analysis of the differential impact of its policies at different points on the income scale, but does not carry out a gender analysis.


OUR RELATED STORIES:

Why does everyone say inequality is falling, when it's rising? Because they're only counting incomes, not all wealth (property, pensions, etc.)

The NHS is not a “cost”. It creates nationwide jobs, technology, growth and wealth. Oh, and health

FTSE bosses take 2.5 days to earn what you earn all year. Data shows they don't deserve it

All governments agree to fix the housing crisis. Latest figures show we're still not even trying

Recovery? What recovery?! Bank of England director explains why broke Britain is still broken

Brexit was about inequality in Britain, not immigration. Have our politicians realised this?

See the Stats: Osborne's 2016 budget protected the wealthiest while the most vulnerable suffer

Inequality: the UK has 9 of the 10 poorest regions in Northern Europe. But Inner London is the richest

Graphs at a glance: With highest pay and highest job growth is London sucking the life out of Britain?

Londoners earn 15% more 'cos London is damn expensive! But the poorest 5th in London are paid only 4% more

Graphs at a glance: Britain is already a low-pay economy with falling average wages

Is your Cost of Living crisis over?! Average wages are still back where they were 10 years ago


Saturday, 25 February 2017

Saturday, February 25, 2017 Posted by Hari 1 comment Labels: , , , , , , ,
Inequality has reduced!

No it hasn’t.

Yes it has! I heard Dimbleby say it on Question Time. And the Lefties all nodded solemnly.

“...the statistics show the gap is narrowing” David Dimbleby 2nd February 2017

That’s because they‘re all clueless.

Never!

They don’t realise they’re only talking about income inequality, not wealth inequality.

What’s that?

Wealth inequality measures all your assets – property, shares, pension pot, that sort of thing.

You mean the really big numbers.

Right. Income is just what’s going into your bank account – pay, dividends, pension payouts, and the rest. Net Income – what they’re referring to when they talk about income inequality - is all that after benefits and taxes have been added and subtracted.

Let me guess. Wealth inequality has risen?

You win a free Question Time T-shirt and nodding duck pencil sharpener. Generally, asset prices have continued to recover since the bank crash, but the poor hardly have any assets!

So the gap between rich and poor continues to rise.

Yup.

And what of the gap between Dimbleby’s ears, and the ears of every card carrying leftie who hasn’t bothered to use this shocking fact that would make every working hour of their lives so much easier?

Hmm. No official data on that one. Looks like the Office for National Statistics needs to tear itself a whole new index.


The background data


Wealth inequality is almost twice that of income inequality. The overall Gini coefficient (the official measure of inequality, where 0=minimum and 1=maximum) for net income is 0.34, while that for total wealth is 0.64.
HRP = age of household reference person


Wealth in Great Britain is even more unequally divided than income. The richest 10% of households hold 45% of all wealth. The poorest 50%, by contrast, own just 8.7%.


Wealth inequality is rising. The ONS report says: “In July 2012 to June 2014, the wealthiest 20% of households had 117 times more aggregate total wealth than the least wealthy 20% of households. In comparison, the wealthiest 20% of households had 97 times more aggregate total wealth than the least wealthy 20% of households in July 2010 to June 2012.”

It goes on the explain: “Figure 2.10 shows the median household total wealth by the levels of household net equivalised income. Households in the lowest band of income had the lowest median household total wealth, while those households in the highest income band had the highest. During July 2012 to June 2014, households in the lowest income band had a median household total wealth of £34,000 while for the highest income group that was over 26 times as big, £225,100. Between the 2 survey periods shown, the median value for those in the lowest 3 income bands fell, whilst the median value of household total wealth increased across all other income bands. The median value of household total wealth fell the most in the lowest income decile, with a 38% fall seen between July 2010 to June 2012 and July 2012 to June 2014, and the largest increase was seen in the top 2 income deciles, with a 19% increase in the median value seen over the same period.”


The South East’s median household total wealth (£342,400) is over twice that of the North East (£150,000). It's another sign of the growing divide between the south and the rest.
Office for National Statistics: Total wealth, Wealth in Great Britain, 2012 to 2014 (Chapter 2)


The poorer regions have got poorer. Yorkshire and The Humber saw a fall in median household total wealth of 8% between July 2010 to June 2012 and July 2012 to June 2014. Smaller falls were also seen in the West Midlands (2%) and East Midlands (1%).


Even income inequality is on an upward trend, when you include housing costs: essential costs like rent or mortgage interest, water charges, insurance premiums, and service charges. This is important as such costs can hardly be avoided. The Resolution Foundation report says “Looking at the 90/10 ratio, income inequality before housing costs peaked in 1991 and has been largely flat or falling since then. But after housing costs, this ratio was higher in 2014-15 than at any point in the 1980s or 1990s.”

Resolution Foundation: Living Standards 2017

Wednesday, 1 February 2017

Wednesday, February 01, 2017 Posted by Hari No comments Labels: , , , , , , ,

[UPDATED 8/3/17] SOURCE GUARDIAN: George Osborne to be paid £650,000 for working one day a week

George Osborne has declared a salary of £650,000 a year for working just four days a month at BlackRock, the world’s biggest fund management firm, as well as almost £800,000 for speeches to financiers. The former chancellor’s earnings were revealed in the latest register of MPs’ interests, which shows that he will make more than eight times his salary as a backbencher as an adviser to the Wall Street firm. He was criticised for taking the job earlier this year, because BlackRock may have benefited from reforms to pension rules made while he was chancellor.

SOURCE DAILY MAIL: A shameless ex-Chancellor: the damning extent of Osborne's murky relationship with the Treasury and the finance giant that's just given him a six-figure job
Former Chancellor George Osborne, who is paid £75,000-a-year to fulfil his duties as an MP, will be working one day a week as an adviser to the vast American finance firm, BlackRock. This position will add around £200,000 a year to the household income at the £4million Notting Hill home he shares with wife Frances and their two young children. It has also reignited the long-standing, and increasingly furious, public debate about the grubby ‘revolving door’ between government and the private sector. Since Tony Blair left Downing Street and began lobbying for a mixture of wealthy corporations and dodgy dictators, it has seemingly become almost automatic for ex-Cabinet Ministers to cash in by using the experience they gained in office for commercial gain. This shoddy practice is theoretically regulated by Acoba, a Whitehall appointments watchdog. Yet in the past eight years, it has not attempted to stop one single civil servant or politician from taking up a job. Osborne’s new role at BlackRock was waved through despite the fact that he’d met executives from the finance giant five times during his last two years at the Treasury. Even without this latest scandalous twist about BlackRock, which has sparked calls for a complete revamp of Parliamentary rules, there can be few dethroned senior politicians who have been quite so shameless and proactive as Osborne in their pursuit of a fast buck. His dash for cash began a mere four weeks after being sacked, when he signed up to an American speaking agency called the Washington Speakers’ Bureau. It represents 602 of what it calls ‘the world’s greatest minds’ — including those noted intellectuals Tony Blair, Alastair Campbell, George W. Bush, the former Alaska governor Sarah Palin and the magician David Blaine — and has already helped Osborne earn £628,000 and counting since he left the Treasury. Some of the financial institutions that have paid to hear Osborne’s words of wisdom are, however, a rum old bunch. They include the aforementioned HSBC, which has paid vast fines in recent years for money-laundering offences in Mexico and Switzerland, and JP Morgan, which bunged the former Chancellor £141,752 for two speeches. This is the same JP Morgan that was last month fined £288 million by European regulators for interest-rate manipulation. Then there is Citi, who coughed up £85,396 for two Osborne speeches in November (this week it was hit with a £23 million fine in the U.S. for mis-treating mortgage holders), and Aberdeen Asset Management, which spent £51,328 getting him to talk to investors two months ago (and which not long ago paid a £7.2 million penalty to the Financial Conduct Authority for failing to properly protect client funds). Most curious of all, however, is a mysterious organisation called Palmex Derivatives that flew Osborne to New York in October, where it paid him £80,240.16 for giving a two-hour talk. This secretive firm — whose operations are said to include financial and insurance activities, security broking and fund management — has no website, no listed telephone number or email address and was, until December, registered to a detached brick home on a cul-de-sac in Southend-on-Sea. Now listed at a service address in Caterham, Surrey, it has just two directors, a 34-year-old ‘futures and options broker’ called Robert Palmer and his domestic partner Kirsty Lewis, who describes her occupation on Companies House documents as ‘home-maker’. In its last published accounts — up to January 2016 — Palmex listed assets of a mere £54,598, so hiring the former Chancellor appears to represent a huge investment for such an apparently small firm. And there is the intimate nature of the relationship Osborne appears to have forged with his new employer, BlackRock, while his day-job was running the British economy.

SOURCE BBC NEWS: Working age families are still £345 poorer than they were before the financial crisis
The average UK household's disposable income - or spending power - rose by nearly £600 in 2015-16. The typical household had £26,332 to spend after taxes were paid and benefits received, the Office for National Statistics (ONS) said. Senior statistician Claudia Wells said: "Household incomes are above their pre-downturn peak overall, but not everyone is better off... While retired households' incomes have soared in recent years, non-retired households still have less money, on average, than before the crash." The ONS puts growing private pensions ahead of the guaranteed rise in the state pension - under the so-called triple lock - as the long-term reason for the pick-up in pensioners' incomes. Household income has tended to pick up faster over the years owing to an increasing number of couples both in employment. Matt Whittaker, chief economist at the Resolution Foundation think tank, said: "Strong employment growth, low inflation and rising pensioner incomes over recent years have helped drive inequality down to its lowest level in nearly 30 years... However, the last three years of growth have come back off the back of a living standards squeeze so deep that typical working age families are still £345 poorer than they were before the financial crisis. With employment plateauing, productivity growth refusing to budge and inflation rising, the risk is that this mini boom won't continue."


OUR RELATED STORIES:

The NHS is not a “cost”. It creates nationwide jobs, technology, growth and wealth. Oh, and health

FTSE bosses take 2.5 days to earn what you earn all year. Data shows they don't deserve it

All governments agree to fix the housing crisis. Latest figures show we're still not even trying

Recovery? What recovery?! Bank of England director explains why broke Britain is still broken

Brexit was about inequality in Britain, not immigration. Have our politicians realised this?

See the Stats: Osborne's 2016 budget protected the wealthiest while the most vulnerable suffer

Inequality: the UK has 9 of the 10 poorest regions in Northern Europe. But Inner London is the richest

Graphs at a glance: With highest pay and highest job growth is London sucking the life out of Britain?

Londoners earn 15% more 'cos London is damn expensive! But the poorest 5th in London are paid only 4% more

Graphs at a glance: Britain is already a low-pay economy with falling average wages

Is your Cost of Living crisis over?! Average wages are still back where they were 10 years ago


Thursday, 26 January 2017

Thursday, January 26, 2017 Posted by Hari No comments Labels: , , , , , , , ,
Where are the jobs and economic growth of tomorrow going to come from? One dead cert is healthcare. So it completely mystifies me that the NHS is always described as a “cost”, whereas increased spending on anything from cars (£71.6bn, up 3%) and games (£4.2bn, up 5%) to soft drinks (£14bn, up 2.7%) and pet products (£4.6bn, up 3%) is celebrated and can win someone a knighthood.

The champions of an economy are the sectors that use high skills, and technological innovation. They are the ones that deliver better products, services, results and overall living standards than they did the year before.

And we’ll always need low and medium skilled jobs. Not just because such jobs support the cutting edge activities, but because getting any product or service out of the door and onto the high street needs skills at every level.

Uniquely, our health industry does it all. From trolley pushers to brain surgeons. From brooms and paperclips to MRI scanners and precision surgical knives.

Healthcare creates jobs from top to bottom within the NHS, and for all the businesses that stock and service the NHS. And on top of all that, uniquely, it does it across the country in every region, rich and poor.

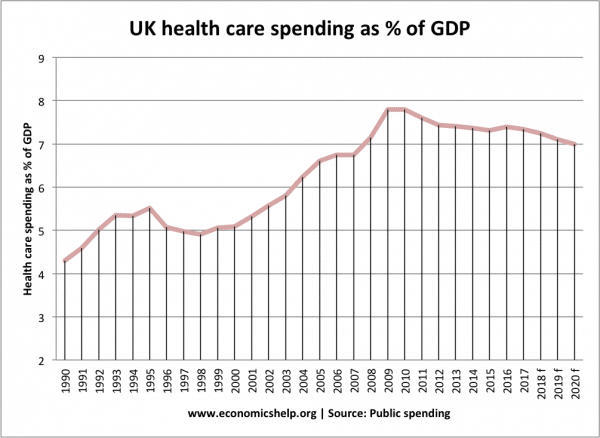
So why are we cutting the NHS? Spending as a percentage of GDP is dropping. Previous governments raised it, recognising it's value in terms of health and wealth.health care spending % GDP

Tory spending per head has flatlined. This is happening while the population is ageing overall, and modern treatments are better yet more expensive.


That’s the core NHS budget. But total health spending in England (which includes things like public health, education and training) is set to fall by almost £5bn over this parliament.

“We can’t afford it!” Why? What were you planning to spend your money on? What makes you think if we spend less on healthcare, we’ll spend it on technology, engineering and other pro-growth sectors in the UK? Give me a tax cut and won’t I spend it on Ubers and coffee, or an imported car that gives one job to a UK car salesman whose skills – polishing a windscreen with his cuff while you sign on the dotted line – haven’t changed since the invention of the car salesman. Our “dazzling” employment figures are holding up overwhelmingly because of the creation of low-skilled, self-employed and zero-hour jobs. As far as UK Plc is concerned, they are dead end jobs.

“We’re cutting NHS fat, not the muscle. They’re efficiency savings.” Show me a report that says the NHS is less efficient than somewhere else. They’re not easy to find. The NHS comes top of most tables. Where it’s beaten (healthy lives: mortality amenable to medical care, infant mortality, and healthy life expectancy at age 60) it’s beaten by countries that simply spend more.

So what’s the difference between spending extra billions via taxes on the NHS, and keeping that money in our pockets so that we can spend it on whatever we like? Big, if you want a modern economy of the top rank (errr... and “universal healthcare free at the point of delivery for all,” you soppy twit). But if you’re offended that someone else (the state) is deciding how your damn money is spent, then you’ll see no difference. Fine, but please take your hands off the nation’s steering wheel, for all our sakes.

Yes, I get it. The right wing ideologues don’t object to spending billions more on the health sector. It’s a sector, and it’s growing, for heaven’s sake! They object to the fact that it’s overwhelmingly publicly owned, and they cannot make profits from it.

Never forget, in the USA where healthcare is the most privatised, health costs leave citizens with less money in their pockets while delivering worse results: $8,233 per capita in the US compared to our $3,268. That's almost £4,000 more spent on healthcare per person, and not on other parts of the economy. It's why the makers and sellers of cars, games, soft drinks and pet products should be the first on the barricades to defend the NHS.

Tuesday, 10 January 2017

Tuesday, January 10, 2017 Posted by Hari No comments Labels: , , , , , , , , ,
KJ and Fee celebrate Theresa May's Tory u-turn, for the moment...
For we know what happens when mainstream, centre-ground politics fails. People embrace the fringe – the politics of division and despair. They turn to those who offer easy answers – who claim to understand people’s problems and always know what – and who – to blame. We see those fringe voices gaining prominence in some countries across Europe today – voices from the hard-left and the far-right stepping forward and sensing that this is their time. But they stand on the shoulders of mainstream politicians who have allowed unfairness and division to grow by ignoring the legitimate concerns of ordinary people for too long. Politicians who embraced the twin pillars of liberalism and globalisation as the great forces for good that they are, but failed to understand that for too many people – particularly those on modest to low incomes living in rich countries like our own – those forces are something to be concerned, not thrilled, about. Politicians who supported and promoted an economic system that works well for a privileged few, but failed to ensure that the prosperity generated by free markets and free trade is shared by everyone, in every corner and community of their land.

The plans aim to make mental health an everyday concern for every bit of the system, helping ensure that no one affected by mental ill-health goes unattended. It includes... new ways to right the injustices people with mental health problems face. Despite known links between debt and mental health, currently hundreds of mental health patients are charged up to £300 by their GP for a form to prove they have mental health issues.


OUR RELATED STORIES:

FTSE bosses take 2.5 days to earn what you earn all year. Data shows they don't deserve it

All governments agree to fix the housing crisis. Latest figures show we're still not even trying

Recovery? What recovery?! Bank of England director explains why broke Britain is still broken

Brexit was about inequality in Britain, not immigration. Have our politicians realised this?

See the Stats: Osborne's 2016 budget protected the wealthiest while the most vulnerable suffer

Inequality: the UK has 9 of the 10 poorest regions in Northern Europe. But Inner London is the richest

Graphs at a glance: With highest pay and highest job growth is London sucking the life out of Britain?

Londoners earn 15% more 'cos London is damn expensive! But the poorest 5th in London are paid only 4% more

Graphs at a glance: Britain is already a low-pay economy with falling average wages

Is your Cost of Living crisis over?! Average wages are still back where they were 10 years ago


Share This

Follow Us

  • Subscribe via Email

Search Us